Warning: include(includes/help_adjoiners.inc.php): Failed to open stream: No such file or directory in C:\inetpub\wwwroot\Help\index.php on line 33
Warning: include(): Failed opening 'includes/help_adjoiners.inc.php' for inclusion (include_path='.;C:\Program Files\PHP\v8.3\pear;E:\inetpub\PhpIncludes') in C:\inetpub\wwwroot\Help\index.php on line 33
Advanced Query
To access: Click "Advanced Query" at the bottom of the "Search" panel.
Depending on the site configuration, it can also be accessed via the "Select Features by Buffer" buttons on the "Identify Details" and "Measure Tools" panels.
Depending on the site configuration, it can also be accessed via the "Select Features by Buffer" buttons on the "Identify Details" and "Measure Tools" panels.
Allows ad-hoc or complex queries of any field(s) in a layer.
To get started:
The most common problem arises when a field is a String data type, but looks like it contains numbers or dates. The query shown above, since the field is numeric (Double), will return the results you would expect. If the field type was String, the query would look like
To get started:
- Select a layer
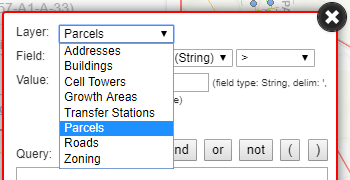
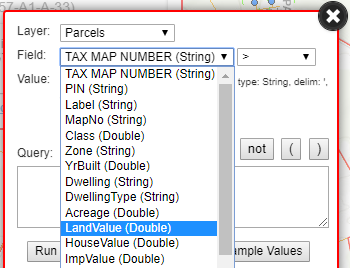
- Select a field
- Select an operator
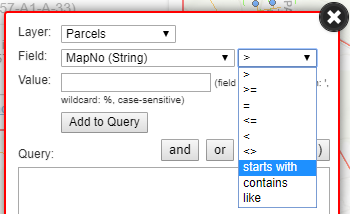
- Enter a value. Depending on field type and underlying data source, useful information like delimiter, wild card and case-sensitivity will be displayed.
- Click "Add to Query". Make more complex queries by repeating the above concatenating them with "and"s and "or"s and grouping with parenthesis.
- Click "Run".
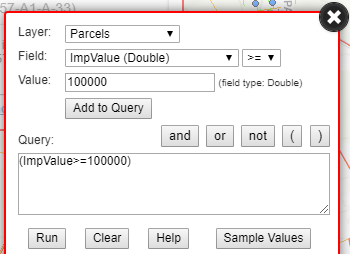
The most common problem arises when a field is a String data type, but looks like it contains numbers or dates. The query shown above, since the field is numeric (Double), will return the results you would expect. If the field type was String, the query would look like
(ImpValue>='100000')and would return records where ImpValue = "200". This is because alphabetically, "2" is bigger than "10" or "100000". The same problem affects dates, where "6/12/1982" is greater than "1/1/2020". Depending on the quality of the underlying data, and your knowlege of SQL, you can sometimes work around it, but it's often hopeless.
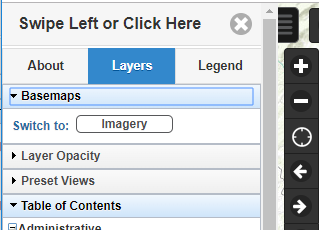
Basemaps
Standard basemaps provided by ESRI. Not all sites have basemaps, those that do generally allow you to toggle between two.
Note: If the site uses the Basemap Toggle, specifying a basemap on the command-line will replace the pre-configured alternate basemap for the duration of your browsing session.
The basemap control is usually on the left panel's Layers tab.
While the basemaps are useful, they do have drawbacks:
The "Measure Tools" does correct for the coordinate system and reports fairly accurate areas and distances.
You can also use a command-line option, "basemap=none" to eliminate the basemap. Note: This feature is not yet implemented in all sites.
The basemap control is usually on the left panel's Layers tab.
While the basemaps are useful, they do have drawbacks:
- They force the use of a very inaccurate coordinate system.
- They limit the zoom scales to a short list of pre-determined values.
The "Measure Tools" does correct for the coordinate system and reports fairly accurate areas and distances.
You can also use a command-line option, "basemap=none" to eliminate the basemap. Note: This feature is not yet implemented in all sites.
Adjoiners
Available when identifying a parcel, the "Adjoiners" button will select all parcels sharing a common line or corner with the selected parcel.
Select by Buffer
Allows you to select features on the same or different layer that are within a given distance of the selected feature, optionally limiting results by attribute values. See the Advanced Query help topic for details. This function also works with features created with the Measure tools.
Command Line Options
In order to integrate with other web pages or programs, WebGIS has several command line options that can be used singly, or in combination.
Example: http://www.webgis.net/va/Blacksburg/?zoom=10926400,3602700,4800&preset=Zoning&op=id&id=1|parcels|parcel_id|035222
Used in combination, the argument order does not matter, but the relevant operations will be performed in this order: preset, id, zoom (turn layers on/off and zoom to preset, identify and zoom to feature, zoom to specified area).
| Common Options and Arguments | |
|---|---|
| basemap | Specify the Basemap (for sites that have basemaps). Example: "basemap=satellite" Valid values are: streets, satellite, hybrid, terrain, topo, gray, dark-gray, oceans, national-geographic, osm, dark-gray-vector, gray-vector, streets-vector, topo-vector, streets-night-vector, streets-relief-vector, streets-navigation-vector Also: none, disables basemaps entirely, not available on all sites. |
| id | Identify a feature on a layer, given a pipe-delimited list of arguments.
The first argument is the layer name, this is almost always the same as the name shown in the Layers TOC.
If there are only 2 arguments, the 2nd argument is the ObjectID (not particularly useful, meant for internal use).
If there are 3 arguments, the 2nd argument is the field name and the 3rd argument is the field value. Example: id=parcels|parcel_id|035222 For backward-compatibility, the old format with a dummy first argument is still supported. Example: op=id&id=0|parcels|parcel_id|035222 Try to use a field with unique vales. If multiple features are found, the first (random) feature will be used. Note: The field names are not always obvious, you can use the Advanced Query tool to discover them. |
| preset | Specify the Preset (for sites that have presets) to apply on load. Example: "preset=zoning" This only works with site-defined presets; user-saved presets do not work. |
| zoom | Zoom to a specific area, or point and scale. Command takes either 3 or 4 comma-separated parameters. Use 3 parameters to specify center point and scale (Format: zoom=x,y,scale). Use 4 parameters to specify opposite corners of a rectangular area. (Format: zoom=x1,y1,x2,y2). x/y coordinates can be decimal degrees, state plane feet or Web Mercator meters. Examples (in Blacksburg VA):
|
| Other Options and Arguments | |
| identify | Set the initial Identify layer. Example: "identify=addresses" |
| search | Set opening search, which is usually "Parcels". This is primarily for internal use, since the names of searches are not obvious, but feel free to contact us if you need help using this feature. |
| tool | Set opening tool, which is usually "Identify".
|
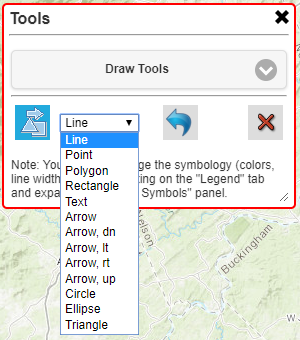
Draw Tools
To access: Click the "Tools" icon  in the top toolbar, then select "Draw Tools" from the pulldown on the "Tools" panel.
in the top toolbar, then select "Draw Tools" from the pulldown on the "Tools" panel.
Add lines, shapes and text to the map. You can control the appearance via the "Edit Symbols" panel.
| Icon Descriptions | |
|---|---|
| Draw the shape selected in the pull-down. | |
| Stop drawing. Same as double-click on map, for Lines and Polygons. Most other symbols are single-click or click-and-drag. |
|
| Delete last item. | |
| Clear all items. Note: Most other functions that draw on the map (such as Identify or Measure) will also clear all the drawn items. See the "Measure" and "View Files" tools for a method of saving your work. | |
Identify
The Identify button is located on the horizontal toolbar on the left side of the map display. Just click the Identify button when you want to change the Active Identify Layer or identify method. The Active Identify Layer selection can be changed from the dialog box that appears. The user can now identify by Point (default), by Rectangle, by Polygon or by MultiPoint.When WebGIS initially loads, identifying parcels by point is usually the default selected tool (site dependent). The user can immediately click or touch the screen to identify parcels.
You can use command-line options to change the initial layer and selection mode.
The user can close the Identify dialog box. WebGIS will remember your settings.
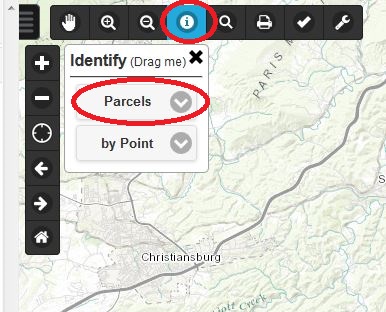
Note: If you use a selection method other than "By Point", remember to change back to "by Point"; the other selection methods can interfere with the normal panning/zooming behavior.
Attributes at Point
Display attributes of polygon layers at a point. While this information is generally useful, it can also be misleading for the following reasons.
- The point used is computed from the selected feature, not the point the user picked on the map (if using Identify). It is done this way to produce consistent results regardless of how the feature was selected.
- The selected feature, a parcel for example, can easily overlap multiple features in other layers, such as soils or zoning, only one of which would be listed. A worst-case example would be a parcel that is 99% in a flood zone, but the computed point happens not to be.
Index
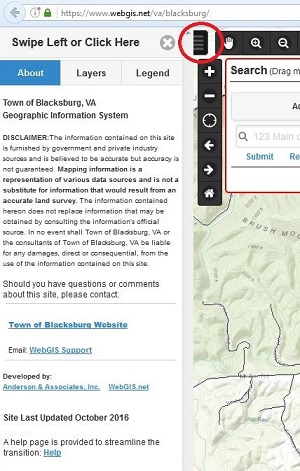
Note: Not all sites have the same tools, or necessarily have the tools configured as shown.Left Panel
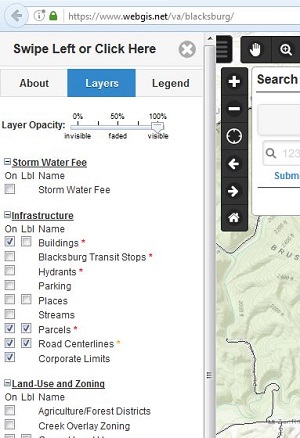
The Left Panel is a sliding panel. It is defaulted to open when WebGIS is loaded on a desktop pc, laptops and tablets. It will be defaulted to close when WebGIS is loaded on smartphones. You will find all the Layers and Legend information in this panel. Simply click the Tab buttons at the top of the Left Panel to access those items. You can close and open it by pressing the toggle button. You can also close it by swiping the panel left. Closing the Left panel will give you a full screen experience.The Left Panel toggle button is circled below. Click it to open and close the panel.
- About Tab
- Shows the Legal Disclaimer information and other relevant information regarding the site.
- Layers Tab
- Turn layers on by clicking an empty box ("On" column) beside the layer. If a layer has 2 boxes the second one ("Lbl" column) will turn on the layer's labels.
- Some layers only are visible at a set scale. Those layers have colored asterisks (**) beside their names. This means you will have to zoom in to see those layers once you turn them on.
-
- A red asterisk (*) means you will have to zoom in to see those layers once you turn them on.
- A orange asterisk (*) means you will have to zoom in to see those layers once you turn them on to see the layer's labels.
- Turn layers or their labels off by clicking a checked box beside the layer.
- Most layers can be faded by using the "Layer Opacity" Slider. This allows the user to turn on a Zoning or Flood layer and fade it to see the imagery underneath.
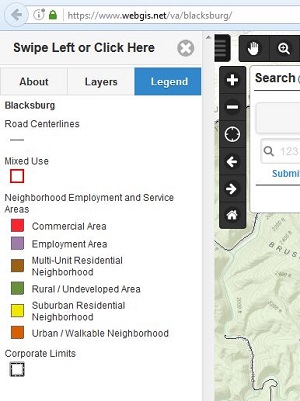
- Legend Tab
- As you turn layers on and off, the Legend will be updated accordingly.
Measure Tools
To access: Click the "Tools" icon in the top toolbar, then select "Measure Tools" from the pulldown on the "Tools" panel.
in the top toolbar, then select "Measure Tools" from the pulldown on the "Tools" panel.
Measure distances and areas. You can control the appearance via the "Edit Symbols" panel.
| Icon Descriptions | |
|---|---|
| Measure area. | |
| Measure distance/perimeter. | |
| Mark multiple points. Useful for selecting multiple non-adjacent features. |
|
| Stop measuring. Same as double-click on map. |
|
| Remove last measure. | |
| Clear all measure data. | |
| Redraw the measure shapes. Useful when another command, such as "Select Features by Buffer", redraws the map. Check "Use new symbology" to use colors, line types, etc. set in the "Edit Symbols" panel. |
|
| Save measure feature(s) to point file. Not available on all browsers. Creates a point file that can be imported with the "View Files" tool. |
|
| Save measure feature(s) to kml file. Not available on all browsers. Creates a kml file that can be viewed in Google Earth or imported with the "View Files" tool. |
|
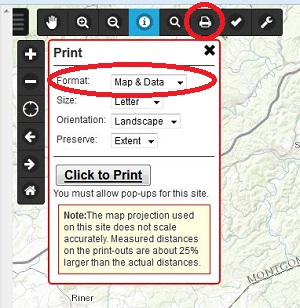
Note: Some sites use basemaps to provide a pretty background image, but basemaps also force the use of a very inaccurate coordinate system. This makes the "Preserve Scale" option nearly useless. You can use the command-line option "basemap=none" to disable basemaps and allow more accurate scaling. (This option is not available on all sites.)
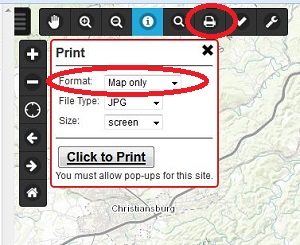
- Format: Map only
- This is the default setting. This setting will produce a screen capture of the map area only.
- To see a print preview, click the "Click to Print" button. The map will open in another window. You will be able to right click and save the image to your location
- Format: Map & Data
- To get a report that includes the map and the information details, change the Format to "Map & Data" as indicated below.
- To see a print preview, click the "Click to Print" button. The map will open in another window with all the data information included.
- You will then have to use your browser print function (Ctrl P) to print the Print results.
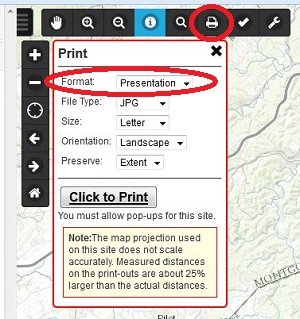
- Format: Presentation
- To get a professional style map for presentations, change the Format to "Presentation" as indicated below.
- To see a print preview, click the "Click to Print" button. The map will open in another window with all the data information included.
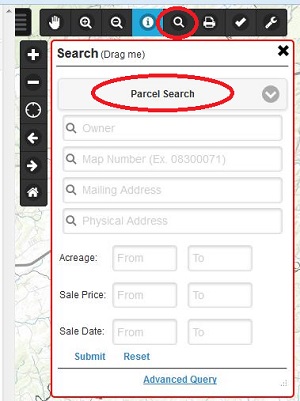
Searches
The Search button is located on the horizontal toolbar on the left side of the map display. The Search box is defaulted to be initialized on startup. Each locality enables different search capabilities so it may look different. Click on the dropdown box to change to a different type of search.Helpful Hint: Start by entering as little as possible, to account for spelling variations, then refine your search to limit the number of results you need to look through.
- Owner example: Search D Smith or Dan Smith rather than Daniel Smith Jr
- Address example: Search 570 Hollow rather than 570 Old Hollow Road
If a search has multiple fields specified, they will be combined by "and". See Advanced Query if you need something more flexible.
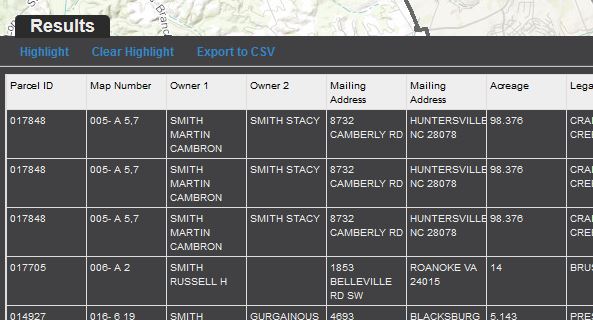
Results
The Results are located across the bottom in a sliding panel, similar to the left panel. It will automatically slide up when results are found. The user can scroll through the table. You can close and open it by pressing the Results button located at the bottom left corner of the map.
- Each field can be sorted by clicking on the field header.
- Click a Row to select and zoom to a desired feature. This will automatically close the Results table. Use the Results button to reopen the table to pick another feature from the list.
- Click the "Highlight" link at the top of the table to highlight all of the results. This will automatically close the Results table. Use the Results button to reopen the table to pick another feature from the list.
- Click the "Clear Highlight" link at the top of the table to clear the highlights.
- Click the "Export to CSV" link at the top of the table to export the results to a comma separated values file that can be imported into MS Excel or Access.
Search Results
Does anyone read help anyway?
Settings
To access: Click the "Tools" icon in the top toolbar, then select "Settings" from the pulldown on the "Tools" panel.
in the top toolbar, then select "Settings" from the pulldown on the "Tools" panel.
Change appearance and behavior of site. If you have local storage enabled for the site, the settings will persist between sessions.
| North Arrow | Display north arrow in upper left corner of map. Currently, north is always top of screen, so a north arrow is somewhat redundant. |
| Auto-hide Windows | Only display one floating panel over the map at a time. Good for de-cluttering small screens. On larger screens, you can move the panels around so they are not on top of each other. |
| Auto-hide Results | Automatically hide the Results panel at the bottom of the map when one of the results is selected. |
| Coordinate Display | Turn on coordinate display at bottom of map to show cursor location. Not particularly useful on touch screen devices. |
| Lat/Long Format | "DMS" displays Lat/Long coordinates in Degrees/Minutes/Seconds format (37°12'18"). "Degrees" displays Lat/Long coordinates in decimal degrees format (37.205). This affects not only the map's coordinate display, but also the data display of the "Measure" and "View Files" tools. |
| Coord. Format | Change the coordinate display of the "Measure" and "View Files" tools. |
Edit Symbols
To access: Open the left panel  , click the "Legend" tab, then expand the "Edit Symbols" panel.
, click the "Legend" tab, then expand the "Edit Symbols" panel.
Change appearance (colors, line widths, etc.) of user-generated features (see below) on the map. If you have local storage enabled for the site, the settings will persist between sessions. Sorry, you cannot change the symbology of the underlying data layers.
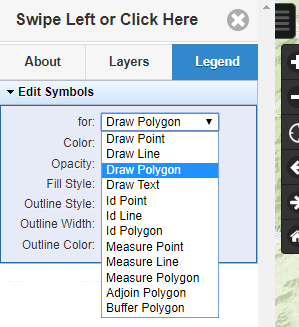
Table of Contents
Toolbars
The various map Navigation and Tool buttons are located within toolbars positioned on the left side of the map display. On smaller devices, some buttons may not be available. On touch enabled devices, zooming can be done by pinching and panning can be done by dragging your finger across the screen.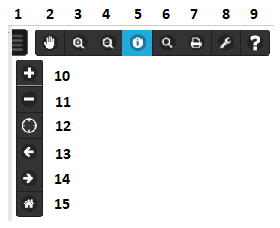
1) Toggle Left Panel
2) Pan map tool
3) Zoom In by box map tool
4) Zoom Out by box map tool
5) Identify features map tool
6) Open Search Window
7) Open Print Window
8) Opens Tools Window
9) Opens Help Kiosk Window
10) Zoom In
11) Zoom Out
12) Zoom to Physical Location (enable GPS)
13) Zoom to Previous Extent
14) Zoom to Next Extent
15) Zoom to Intial Extent
Tools
To access: Click the "Tools" icon in the top toolbar.
in the top toolbar.
| Bookmarks | Save a named view of the current display extents. See also "Presets". |
| Draw Tools | Draw lines, shapes and text on the map. Details |
| Measure Tools | Measure lengths and areas. Details |
| Settings | Change how the site looks or acts. Details |
| View Files | Import and display various files on the map. Details |
| ZoomTools | Zomm to specific location or scale. Details |
View Files
To access: Click the "Tools" icon in the top toolbar, then select "View Files" from the pulldown on the "Tools" panel.
in the top toolbar, then select "View Files" from the pulldown on the "Tools" panel.
Tool to read several types of files and display them on the map.
File Type
- Kml: A standard Google Earth KML file.
- Point: A delimited text file of x/y coordinates. Details
- Shape: A standard ESRI shape file consisting of a pair of .shp and .shx files.
- Traverse: A text file in ESRI ArcMap traverse file format.
Traverse file details and sample.
Files
For Kml, Point and Traverse types, multiple files can be loaded at once. Shape files only support loading a singe pair of .shp/.shx files. Due to performance issues, files containing more than a few hundred records are not recommended.
Input Coordinate System
Coordinate system can be Longitude/Latitude (decimal degrees), Web Mercator (meters) or the appropriate NAD 83 State Plane (feet). Does not apply to Kml files, which are always Longitude/Latitude. When loading multiple files, all coordinate systems must be the same.
Drawing Symbology
Symbology is controlled by "Draw Point", "Draw Line" and "Draw Polygon" items on the "Edit Symbols" panel (on the "Legend" tab in most sites). Click "Clear" and "Redraw" after changing settings.
View Files - Point File Details
The file can contain comments - any line that starts with "#", "//" or "'" (apostrophe/single quote) will be ignored.
The file can contain multiple features, separated by "magic" line "##NEWREC". Not applicable for "Treat as: Points", they are always individual features.
For "Treat as:", Polylines require at least 2 points per feature; Polygons require at least 3 points per feature.
Example 1:
The file can contain multiple features, separated by "magic" line "##NEWREC". Not applicable for "Treat as: Points", they are always individual features.
For "Treat as:", Polylines require at least 2 points per feature; Polygons require at least 3 points per feature.
Example 1:
#Sample tab-delimited point file
#X column: 1, Y column: 2
#Coordinates in state plane feet
#H&P Blacksburg VA Office
10926167	3602873
10926543	3602928
10926644	3602521
10926312	3602460
10926167	3602873
Example 2:
#Sample comma-delimited point file
#X column: 2, Y column: 3
#with multiple features
#H&P Blacksburg VA Office
1,10926167,3602873
2,10926543,3602928
3,10926644,3602521
4,10926312,3602460
5,10926167,3602873
##NEWREC
1,10926156,3602822
2,10926427,3602893
3,10926459,3603191
4,10926056,3603128
5,10926156,3602822
##NEWREC
1,10926481,3603195
2,10926672,3603223
3,10926663,3602907
4,10926536,3602894
5,10926562,3603145
6,10926482,3603141
7,10926481,3603195
View Files - Traverse File Details
Useful for displaying your deed or survey plat on the map. Use the "Delta Angle" to more closely align deed/plat north with map north. Use the "Clear" and "Reload" buttons to adjust the angle without re-selecting the file(s).
The tool only supports the following tags:
Only one feature is allowed per file, but you can load multiple files at the same time.
The file can contain comments - any line that starts with "#", "//" or "'" (apostrophe/single quote) will be ignored.
Example:
| DT | optional, must be QB if included |
| DU | optional, must be DMS if included |
| SP | x y: one record required. XY Coordinates can be Longitude/Latitude, State Plane (feet), or Web Mercator (meters). |
| DD | bearing distance: at least one record is required. Distance must be in feet. |
Only one feature is allowed per file, but you can load multiple files at the same time.
The file can contain comments - any line that starts with "#", "//" or "'" (apostrophe/single quote) will be ignored.
Example:
#Sample Traverse File
#H&P Blacksburg VA Office
SP -80.41177 37.20236
DD N81-44-14E 380
DD S13-58-14E 419
DD S79-28-59W 338
DD N19-17-07W 438
Zoom Tools
To access: Click the "Tools" icon in the top toolbar, then select "Zoom Tools" from the pulldown on the "Tools" panel.
in the top toolbar, then select "Zoom Tools" from the pulldown on the "Tools" panel.
| Format: | Select the coordinate input format. If your browser has local storage enabled, this setting will be remembered. |
| Latitude/ North (y) | Just what it says |
| Longitude/ East (x) | Just what it says |
| get current map center | Populates coordinate boxes with the coordinates of the map center. Same as leaving coordinate boxes empty. |
| get physical location | Populates coordinate boxes with your physical location. Your browser settings need to allow this site to access location data. |
| Scale: | Some sites allow arbitrary scales, others have a set number of pre-determined scales/levels. |
| get current | Populates scale box with the current map scale. |